Leading vs. Lagging Indicators: How to Stop Mixing Your Signals
Stop paralyzing your charts with redundant data. Discover the crucial differences between Leading and Lagging indicators, and learn how professional traders pair trend-following tools with momentum oscillators to perfectly time their market entries.
Direct answer
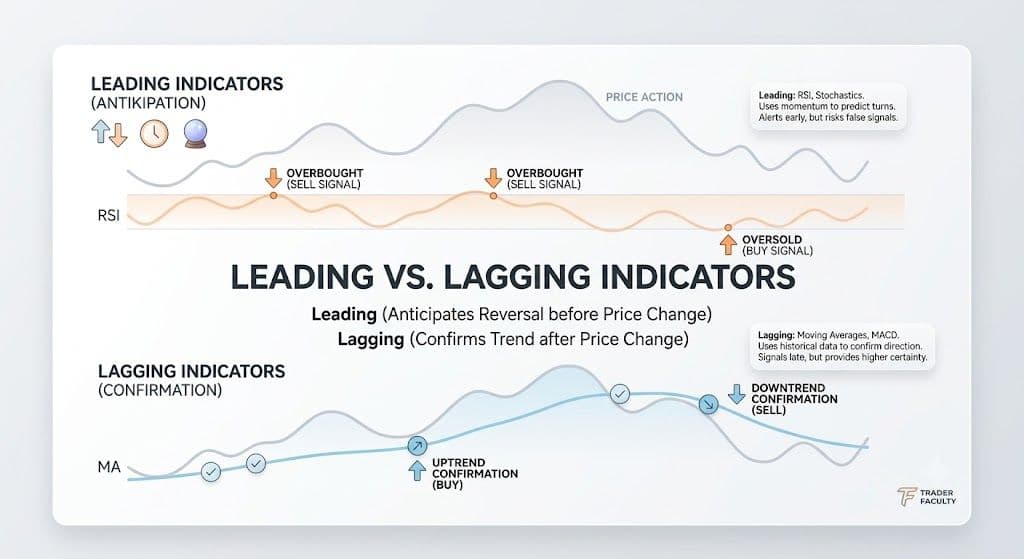
The main difference between leading and lagging indicators is that leading indicators (such as RSI and Stochastics) measure price momentum to anticipate market reversals before they occur, while lagging indicators (such as Moving Averages and MACD) filter historical data to confirm an established trend after the price has already moved.
1. Lagging Indicators (Trend-Following Tools)
Lagging indicators calculate data based on past price action. Because they rely on history, they give signals after a move has already begun.
- Examples: Moving Averages (MA), MACD.
- The Pros: Highly reliable for confirming the overall direction of a trend and filtering out market noise.
- The Cons: You will rarely buy the absolute bottom or sell the absolute top; you enter late but with higher certainty.
2. Leading Indicators (Momentum Tools)
Leading indicators are designed to anticipate short-term price reversals and measure the speed of price movements.
- Examples: Relative Strength Index (RSI), Stochastics.
- The Pros: Excellent for identifying overbought or oversold conditions before the price turns around.
- The Cons: They frequently give "false signals" when the market is locked in a powerful, one-directional trend.

FAQ
- Which type of indicator is better for beginner traders?
- Neither is inherently better; they serve different defensive and offensive purposes. Beginners should start with lagging indicators (like Moving Averages) to easily identify the dominant market trend, then gradually introduce leading indicators to help refine their specific entry points.
- Is the MACD a leading or lagging indicator?
- The MACD is primarily a lagging (trend-following) indicator because it is based on the interaction between two moving averages. However, its histogram component can sometimes act as a leading signal by showing shifts in momentum before the moving average lines cross.
The content provided in this guide by Trader Faculty is for educational and informational purposes only. It does not constitute financial advice, investment recommendations, or an endorsement of any specific trading strategy or indicator configuration. Traders should perform their own due diligence, backtest strategies thoroughly, and consult with a certified financial advisor before executing trades with real funds.